Fig. 6
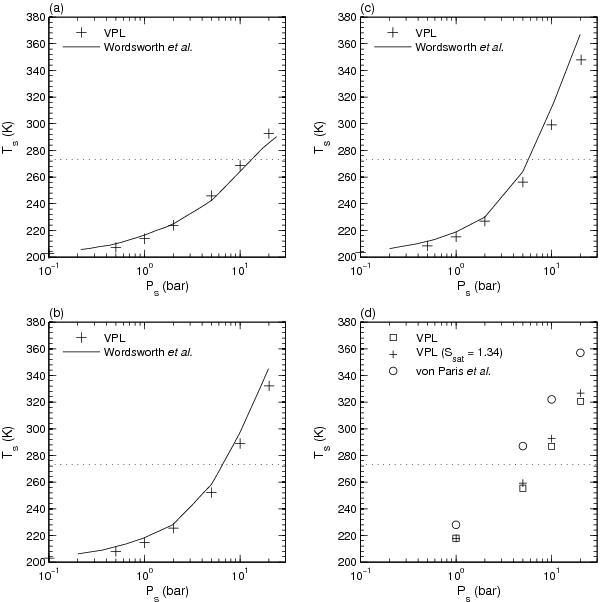
Comparison of our simulation results for Gl 581d with that in WW and vP. Plots a-c compare the results of WW with our results, and plot d compares the result of vP with our results. a) Dry atmosphere with considering CO2 condensation, b) moist atmosphere with fixed RH, dry adiabatic lapse rate and considering condensation of CO2, and c) same as b), except for saturated water vapor (RH = 100%) in the troposphere. In plots a)–c), As = 0.20, gravity g = 20 m s-2. The dry atmosphere here is pure CO2, and the moist atmosphere is dominated by CO2 and contains a minor component of water vapor. The vertical distribution of RH is the Manabe-Wetherald type, with surface RH = 0.77. In plot d), parameters are same as that in vP, that is, As = 0.13, gravity g = 23.76 m s-2, CO2 concentration is 95%, the vertical distribution of RH is the Manabe-Wetherald type with surface RH = 0.80, and CO2 is super-saturated. Here, Ssat indicates super-saturation of CO2. In all the plots, Ts values by WW and vP are estimated from their figures.
Current usage metrics show cumulative count of Article Views (full-text article views including HTML views, PDF and ePub downloads, according to the available data) and Abstracts Views on Vision4Press platform.
Data correspond to usage on the plateform after 2015. The current usage metrics is available 48-96 hours after online publication and is updated daily on week days.
Initial download of the metrics may take a while.