Open Access
Fig. 1
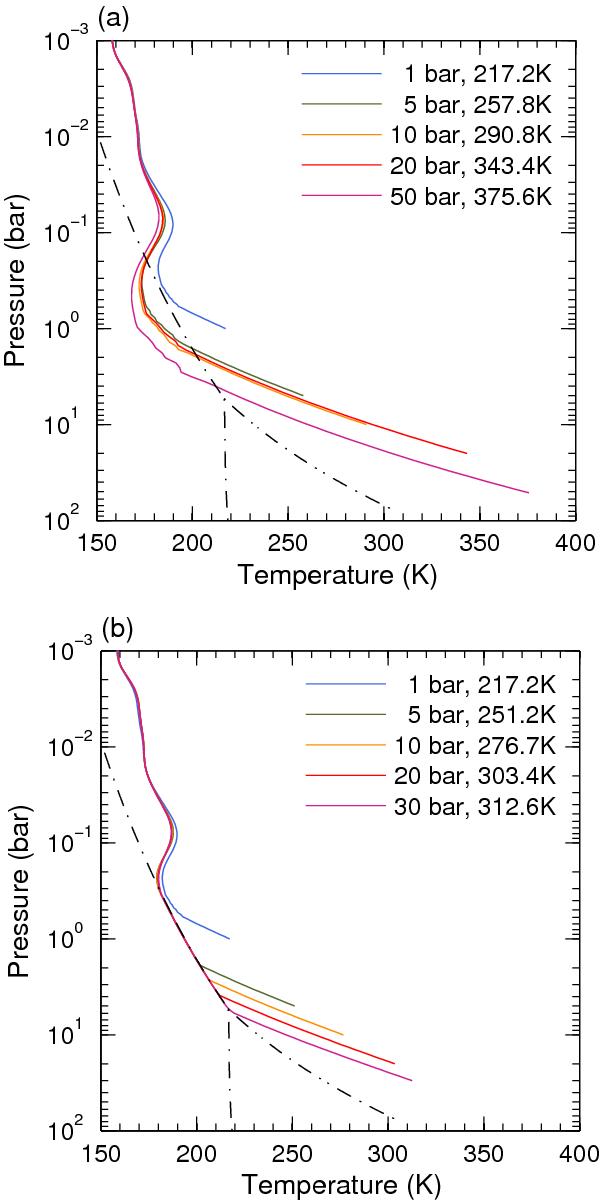
Simulated vertical temperature profiles for a dry atmosphere of Gl 581d with different CO2 levels. Dashed-dotted lines indicate CO2 phase diagram. a) CO2 condensation is not considered, and b) CO2 condensation is considered.
Current usage metrics show cumulative count of Article Views (full-text article views including HTML views, PDF and ePub downloads, according to the available data) and Abstracts Views on Vision4Press platform.
Data correspond to usage on the plateform after 2015. The current usage metrics is available 48-96 hours after online publication and is updated daily on week days.
Initial download of the metrics may take a while.