Free Access
Fig. 3
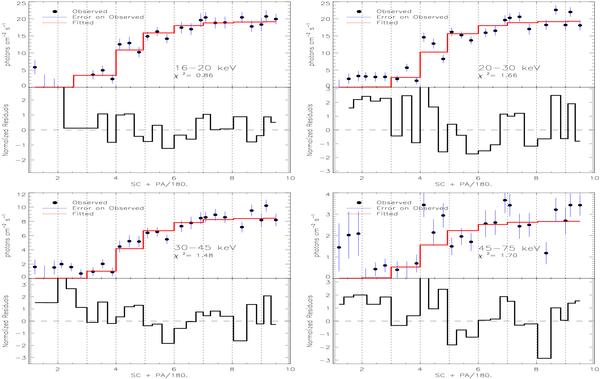
Visibility fits for the four energy bands. The top half in each panel shows the measured visibility amplitudes (black dots) with statistical errors (blue lines) and the model fitted to the visibilities (red). The bottom half in each panel gives the normalised residuals.
This figure is made of several images, please see below:
Current usage metrics show cumulative count of Article Views (full-text article views including HTML views, PDF and ePub downloads, according to the available data) and Abstracts Views on Vision4Press platform.
Data correspond to usage on the plateform after 2015. The current usage metrics is available 48-96 hours after online publication and is updated daily on week days.
Initial download of the metrics may take a while.