Fig. 5
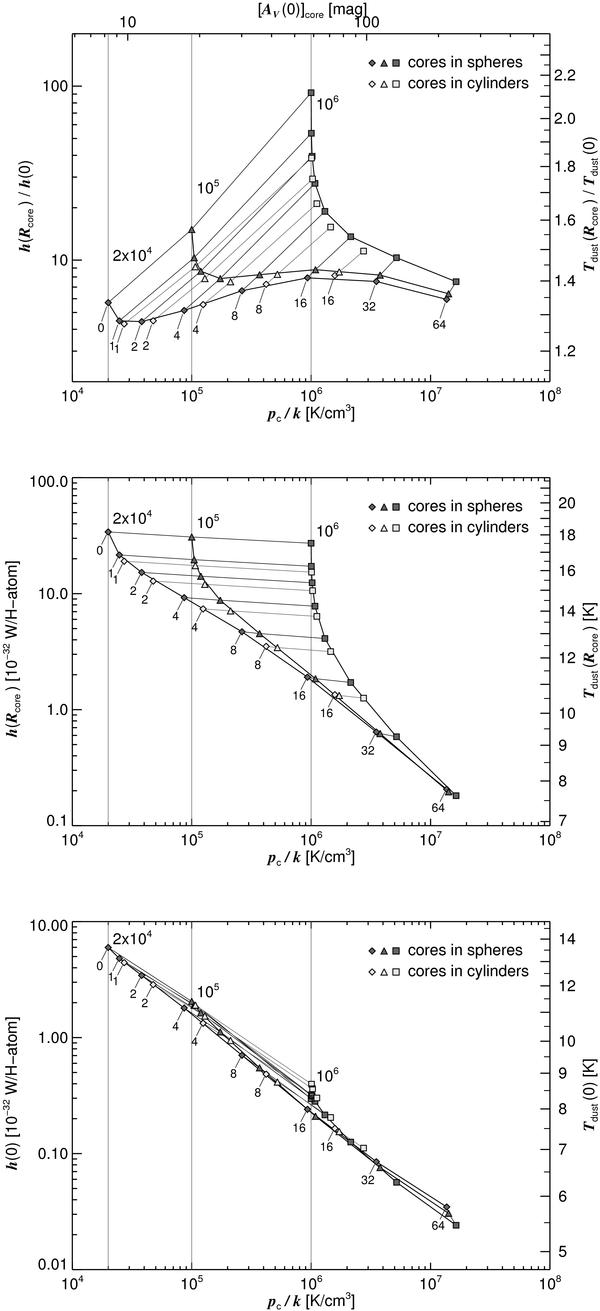
Ratio h(Rcore)/h(0) (top figure), the heating rate h(Rcore) at the cores’ edge (central figure), and the heating rate in the core center h(0) (bottom figure) as a function of the central pressure in the filaments for the three different assumption of the external pressure pext. For comparison also the corresponding dust temperatures of a simplified dust model are shown. For sake of clarity the values obtained for cores in spherical filaments which are pressurized by the same external pressure pext are given as solid black curves. The values are labelled with the considered extinction values AV through the filaments’ center.
Current usage metrics show cumulative count of Article Views (full-text article views including HTML views, PDF and ePub downloads, according to the available data) and Abstracts Views on Vision4Press platform.
Data correspond to usage on the plateform after 2015. The current usage metrics is available 48-96 hours after online publication and is updated daily on week days.
Initial download of the metrics may take a while.