Fig. 3
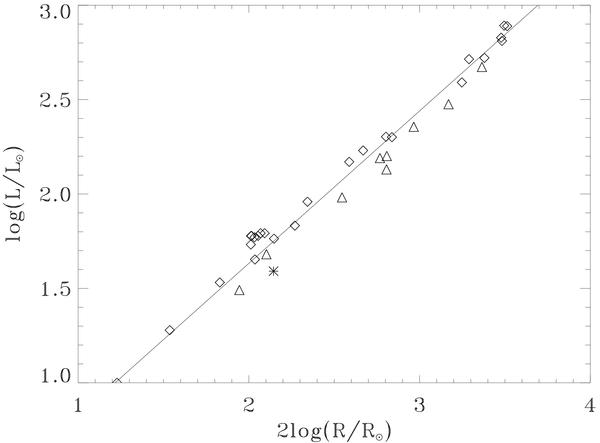
Distribution of the current stellar sample in the log luminosity versus log squared radius diagram. The solid line is a linear fit to the sample by minimization of χ2. Triangles: group II, the nine giants having the largest radius with respect to the corresponding fitted radius of the sample. Diamonds: the other giants. Star: δ1Tau.
Current usage metrics show cumulative count of Article Views (full-text article views including HTML views, PDF and ePub downloads, according to the available data) and Abstracts Views on Vision4Press platform.
Data correspond to usage on the plateform after 2015. The current usage metrics is available 48-96 hours after online publication and is updated daily on week days.
Initial download of the metrics may take a while.