Fig. 5
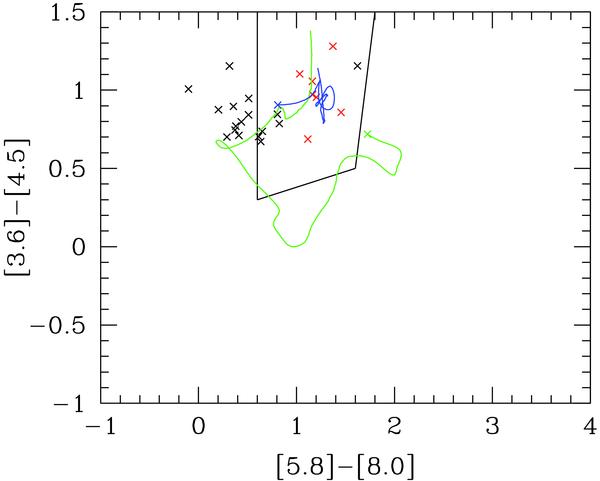
Mid-IR colour-colour plot. Black and red crosses correspond to star-forming and AGN SEDs respectively. The wedge defines the AGN region following the selection criteria of Stern et al. (2005). The colour tracks define two different template SEDs as a function of redshift up to z = 3. The blue line represents the Mrk231 (ULIRG, Compton-thick) template, while the green line represents Arp220 (ULIRG, star-forming) SED. For each template the position of the redshift z = 0 is marked with a large cross. The templates are taken from Polletta et al. (2007).
Current usage metrics show cumulative count of Article Views (full-text article views including HTML views, PDF and ePub downloads, according to the available data) and Abstracts Views on Vision4Press platform.
Data correspond to usage on the plateform after 2015. The current usage metrics is available 48-96 hours after online publication and is updated daily on week days.
Initial download of the metrics may take a while.