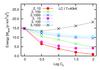
Fig. 5
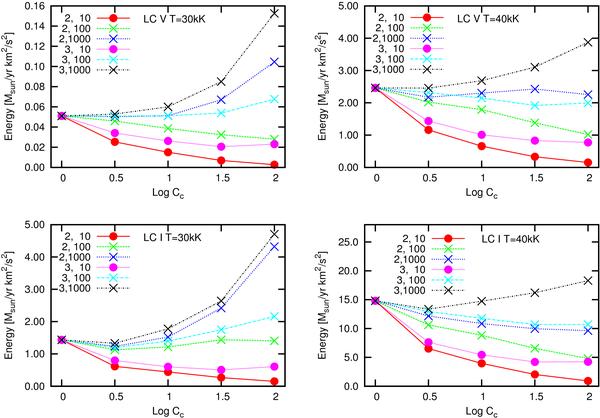
Wind energy predictions accounting for both clumping and porosity of the clumping stratification in which clumping sets in at the sonic velocity (models labeled 2) and at 0.4 3∞ (models labeled 3). The scale of the clumps is given by Hρ/D, where D = 10,100,1000. These results should be compared to the corresponding models in Fig. 4, which account for clumping but not for porosity. The addition of porosity always causes a decrease in Ekin. See Sect. 3.2 for a discussion.
Current usage metrics show cumulative count of Article Views (full-text article views including HTML views, PDF and ePub downloads, according to the available data) and Abstracts Views on Vision4Press platform.
Data correspond to usage on the plateform after 2015. The current usage metrics is available 48-96 hours after online publication and is updated daily on week days.
Initial download of the metrics may take a while.