Fig. 1
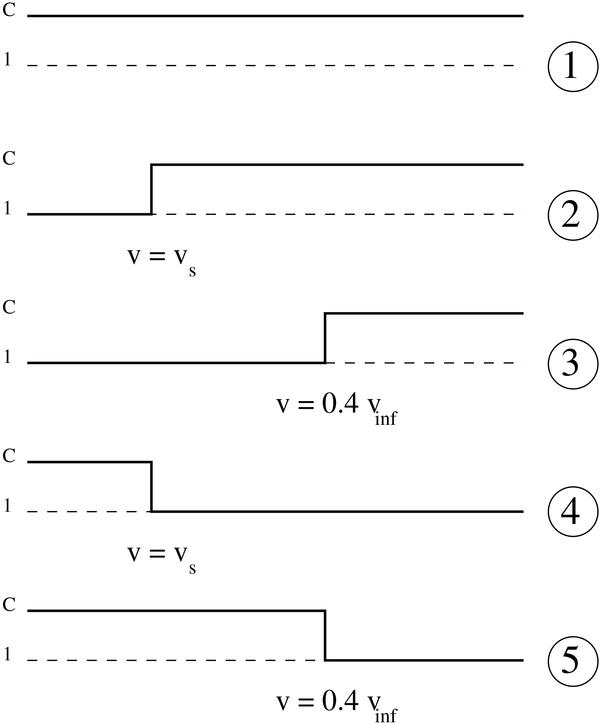
Schematic representation of the different clumping stratifications investigated in this study. Each stratification has been given an index number (at the right side of the figure), which is used in Fig. 4. They represent (1) constant clumping, (2) clumping starting at the sonic point, (3) clumping starting at 0.4 3∞, (4) clumping up to the sonic point, and (5) clumping up to 0.4 3∞.
Current usage metrics show cumulative count of Article Views (full-text article views including HTML views, PDF and ePub downloads, according to the available data) and Abstracts Views on Vision4Press platform.
Data correspond to usage on the plateform after 2015. The current usage metrics is available 48-96 hours after online publication and is updated daily on week days.
Initial download of the metrics may take a while.