Free Access
Fig. 4
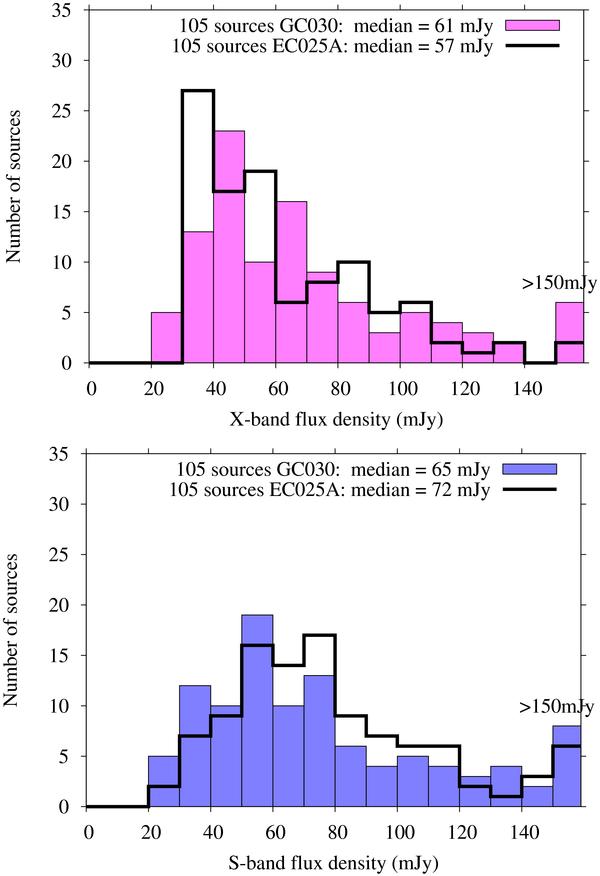
Distribution of the total flux densities at X- and S-bands for the 105 sources observed during GC030. The corresponding mean correlated flux density distribution determined during EC025A for the same sources is plotted in black.
This figure is made of several images, please see below:
Current usage metrics show cumulative count of Article Views (full-text article views including HTML views, PDF and ePub downloads, according to the available data) and Abstracts Views on Vision4Press platform.
Data correspond to usage on the plateform after 2015. The current usage metrics is available 48-96 hours after online publication and is updated daily on week days.
Initial download of the metrics may take a while.