Fig. 9
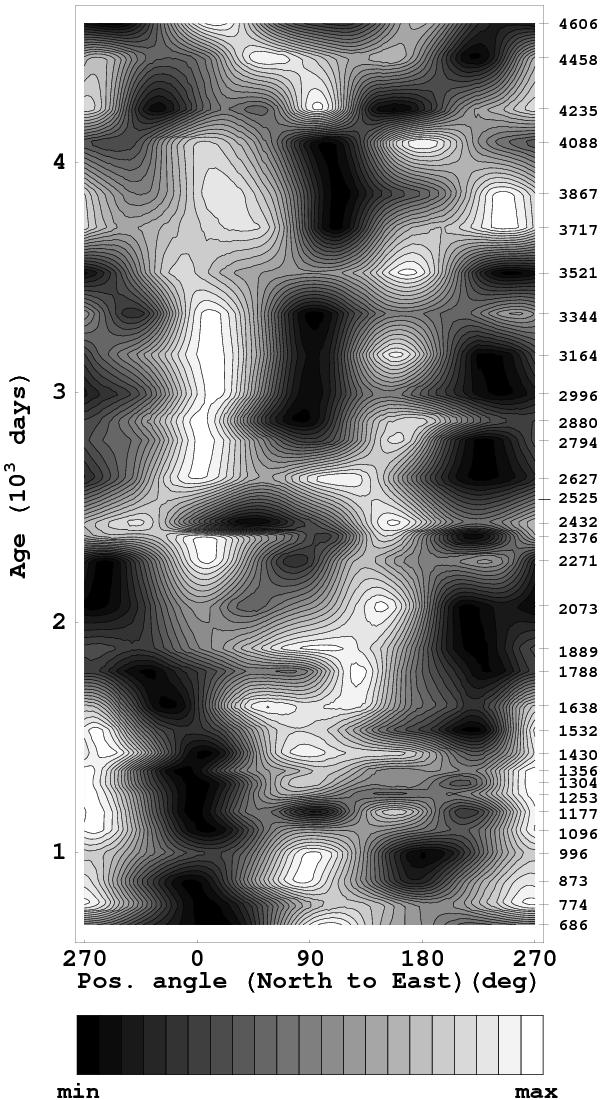
Evolution of the azimuthal intensity distribution in the SN 1993J shell, computed as the linear time interpolation of a selection of epochs (see text). The supernova age at the selected epochs is marked with ticks (right). The 20 contours shown are normalized at each epoch, and equally distributed between the minimum (black) and maximum (white) intensities in the shell.
Current usage metrics show cumulative count of Article Views (full-text article views including HTML views, PDF and ePub downloads, according to the available data) and Abstracts Views on Vision4Press platform.
Data correspond to usage on the plateform after 2015. The current usage metrics is available 48-96 hours after online publication and is updated daily on week days.
Initial download of the metrics may take a while.