Fig. 3
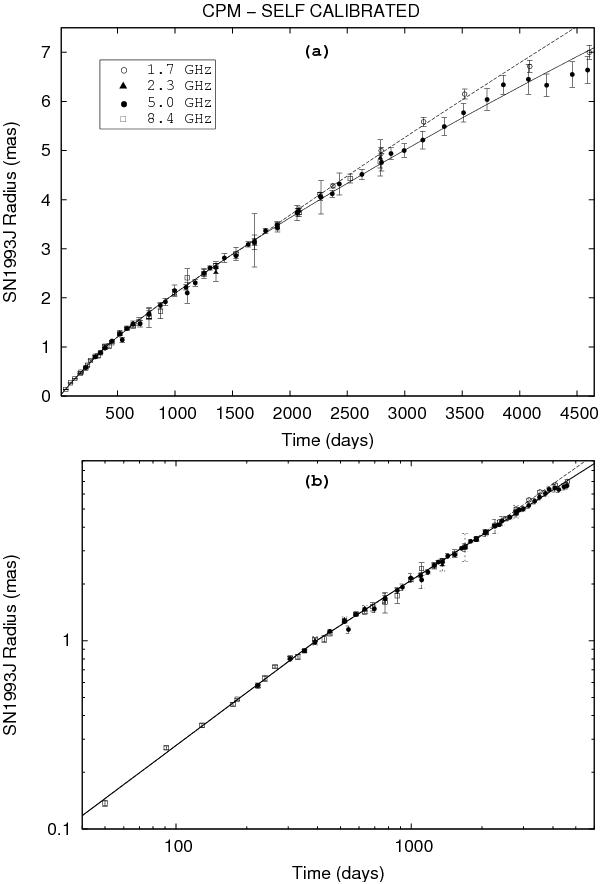
a) Expansion of supernova SN 1993J. The radii were measured with the CPM applied to the images obtained from the process described in Sect. 2 (we call these sizes RSC). The dashed line corresponds to the model given by Eq. (2), fitted to only the 1.7 GHz data. The continuous line is the model given by Eq. (1), fitted to the data at higher frequencies. b) Same as in a), but in logarithmic scale.
Current usage metrics show cumulative count of Article Views (full-text article views including HTML views, PDF and ePub downloads, according to the available data) and Abstracts Views on Vision4Press platform.
Data correspond to usage on the plateform after 2015. The current usage metrics is available 48-96 hours after online publication and is updated daily on week days.
Initial download of the metrics may take a while.