Fig. 7
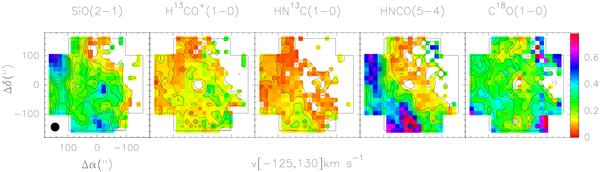
X/CS(1–0) intensity ratios in the full velocity range shown at the bottom of the figure. X stands for SiO(2–1), H13CO+(1–0), HN13C(1–0), HNCO(5–4), and C18O(1–0), whose emission is shown in contour levels. Intensity ratios have been derived considering only pixels with emission above the 3σ level. The wedge to the right shows the color scale of the intensity ratios. Contour levels are −3σ (dashed contour) and from 3σ in steps of 4σ (3.9 and 5.2 K km s-1 for SiO/H13CO+/HN13C and HNCO/C18O ratios, respectively).
Current usage metrics show cumulative count of Article Views (full-text article views including HTML views, PDF and ePub downloads, according to the available data) and Abstracts Views on Vision4Press platform.
Data correspond to usage on the plateform after 2015. The current usage metrics is available 48-96 hours after online publication and is updated daily on week days.
Initial download of the metrics may take a while.