Fig. 6
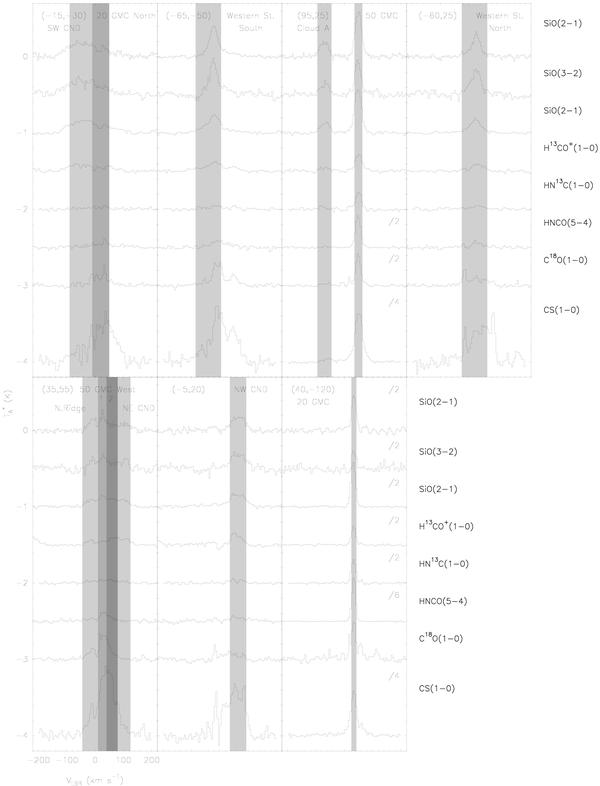
Spectra of the observed transitions taken at 7 selected positions (marked with open squares in Fig. 4). The upper SiO(2–1) and the SiO(3–2) spectra were observed simultaneously at the offset positions respect to Sgr A∗ (in arcseconds) shown in the upper-left corner of each panel. The other SiO(2–1) spectra, together with the other molecular line spectra, were extracted from their respective data cubes from squares of area 30′′ × 30′′. Shadowed areas represent the selected velocity ranges where integrated intensities of the observed molecular lines were obtained, labeled with the names of their associated features. The intensity of some transitions has been divided by a factor shown in the upper-right corner of the corresponding spectrum.
Current usage metrics show cumulative count of Article Views (full-text article views including HTML views, PDF and ePub downloads, according to the available data) and Abstracts Views on Vision4Press platform.
Data correspond to usage on the plateform after 2015. The current usage metrics is available 48-96 hours after online publication and is updated daily on week days.
Initial download of the metrics may take a while.