Fig. 5
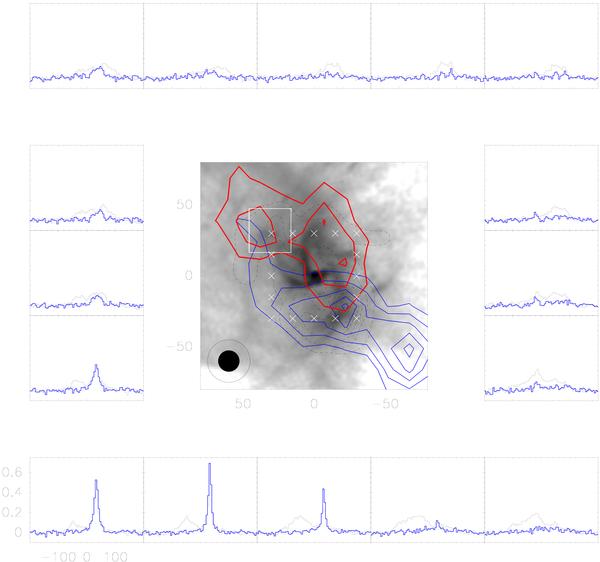
Composition of the velocity-integrated maps of the SiO(2–1) emission at extreme velocities (velocity ranges between [−50, −20] km s-1 in thin blue contours and [70, 100] km s-1 in thick red ones), superimposed on the radio continuum image of Yusef-Zadeh & Morris (1987) at 6 cm in gray scale. Black dashed contours correspond to the HCN(4–3) interferometric map of the CND (Montero-Castaño et al. 2009) smoothed to 15′′ resolution. The SiO(2–1) contour levels goes from 2 K km s-1 in steps of 1 K km s-1. The white crosses indicate the centers of the 30′′ × 30′′ squares where the shown spectra of SiO (black lines) and HNCO (thick blue lines) have been obtained. The beam size of the SiO(2–1) and HCN(4–3) emissions are shown as open and filled circles, respectively, in the bottom-left corner of the map.
Current usage metrics show cumulative count of Article Views (full-text article views including HTML views, PDF and ePub downloads, according to the available data) and Abstracts Views on Vision4Press platform.
Data correspond to usage on the plateform after 2015. The current usage metrics is available 48-96 hours after online publication and is updated daily on week days.
Initial download of the metrics may take a while.