Fig. 4
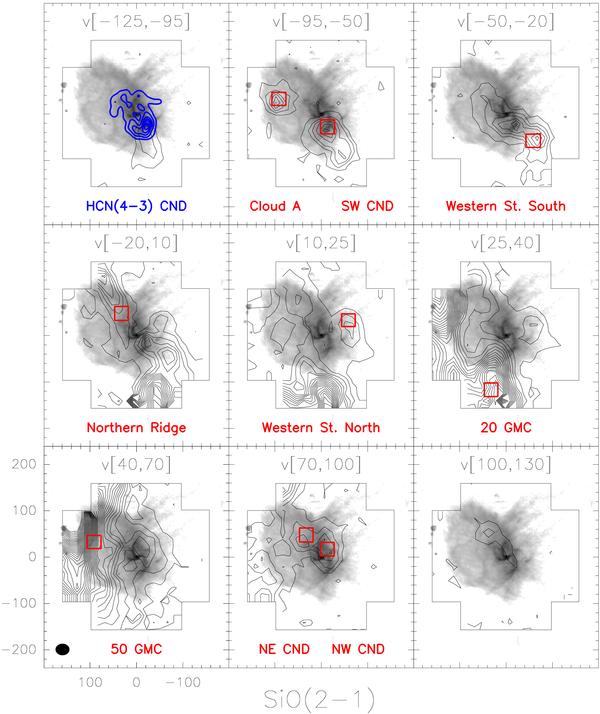
Selected velocity-integrated maps of SiO(2–1) emission superimposed on the radio continuum image of Yusef-Zadeh & Morris (1987) at 6 cm in gray scale. We can appreciate the thermal feature Sgr A West, also known as the Minispiral, in the center of the image. The first two level contours are −0.7 0.7, −1.0 1.0, and −1.2 1.2 K km s-1 for integrated velocities 15, 30, and 45 km s-1, respectively. Steps between levels are 1 K km s-1. Open squares indicate the spatially integrated areas where spectra of Fig. 6 were obtained, which are associated with the main identified molecular features, whose names are indicated at the bottom of each corresponding panel. In the first panel, we also show the HCN(4–3) map of the CND of Montero-Castaño et al. (2009) smoothed to 15′′ in thick blue contours.
Current usage metrics show cumulative count of Article Views (full-text article views including HTML views, PDF and ePub downloads, according to the available data) and Abstracts Views on Vision4Press platform.
Data correspond to usage on the plateform after 2015. The current usage metrics is available 48-96 hours after online publication and is updated daily on week days.
Initial download of the metrics may take a while.