Fig. 3
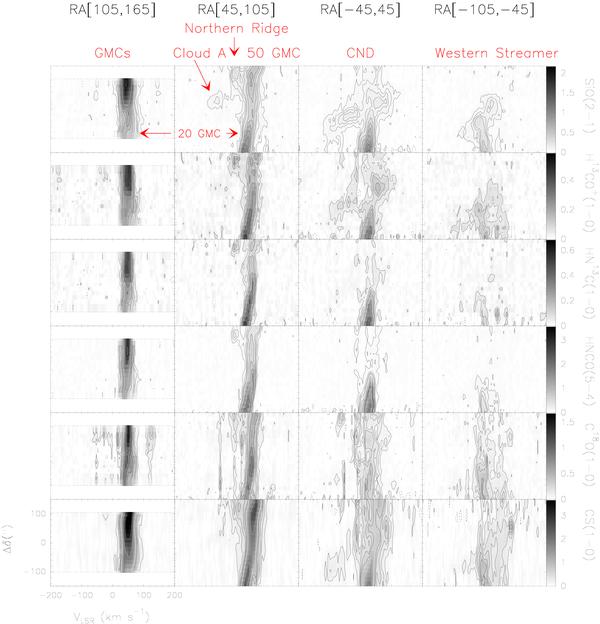
Declination-velocity maps for the different molecules observed at the Sgr A complex. The Δδ-v maps have been averaged in the right ascension ranges shown at the top of each column. Black contour levels are −3 (dashed contour), 3, 6, 9, and 12σ. The following contours are in steps of 9σ until 1 K. In the case of the CS(1–0) maps, black contour levels are −3 (dashed contour), 3, 6, 9, 12, and 15σ. The following contours are in steps of 12σ. White contours begin from 1 K and are in steps of 1 K. The 3σ levels corresponding to the 60′′ and 90′′ wide right ascension ranges are 0.04 and 0.03 K for the SiO(2–1), H13CO+(1–0), and HN13C(1–0) maps; 0.06 and 0.04 K for the HNCO(5–4) and C18O(1–0) maps; and 0.15 and 0.12 K for the CS(1–0) maps. The wedge on the right shows the intensity gray scale for each molecular line.
Current usage metrics show cumulative count of Article Views (full-text article views including HTML views, PDF and ePub downloads, according to the available data) and Abstracts Views on Vision4Press platform.
Data correspond to usage on the plateform after 2015. The current usage metrics is available 48-96 hours after online publication and is updated daily on week days.
Initial download of the metrics may take a while.