Fig. 11
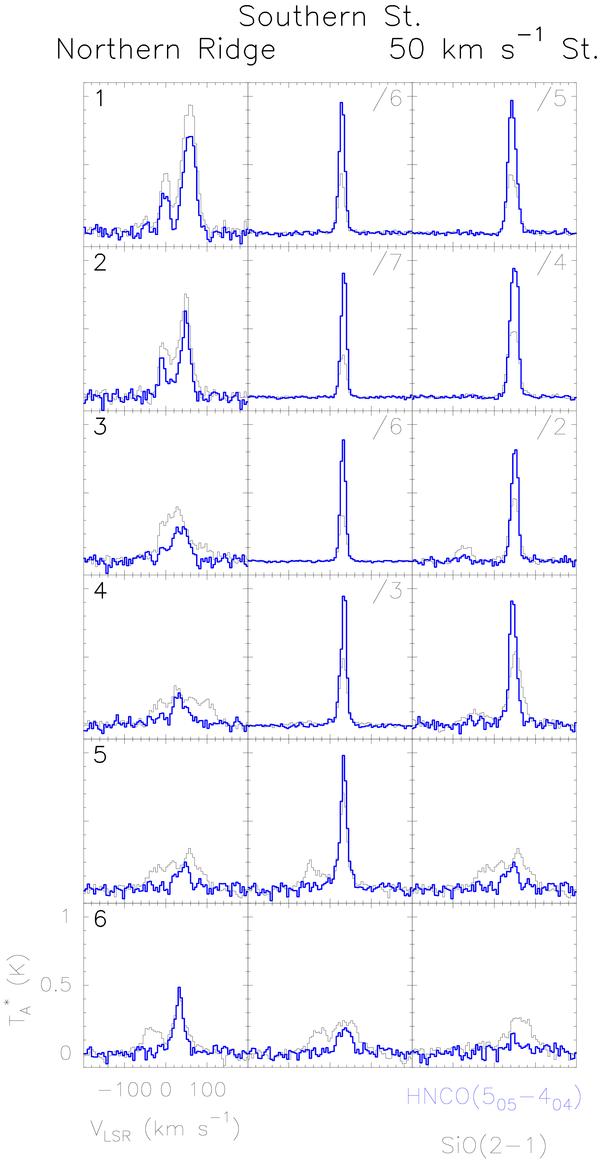
SiO(2–1) (black line) and HNCO(5–4) (thick blue line) selected spectra taken along the Northern Ridge (left column), Southern Streamer (middle column) and 50 km s-1 Streamer (right column). In the maps at the top of Fig. 10, the areas where the spectra have been obtained can be seen as white open squares. Their numbers appear in the upper-left corner of each spectrum of the left column. The intensity of SiO(2–1) and HNCO(5–4) have been divided in some cases by a factor shown in the upper-right corner of the corresponding panel.
Current usage metrics show cumulative count of Article Views (full-text article views including HTML views, PDF and ePub downloads, according to the available data) and Abstracts Views on Vision4Press platform.
Data correspond to usage on the plateform after 2015. The current usage metrics is available 48-96 hours after online publication and is updated daily on week days.
Initial download of the metrics may take a while.