Fig. 10
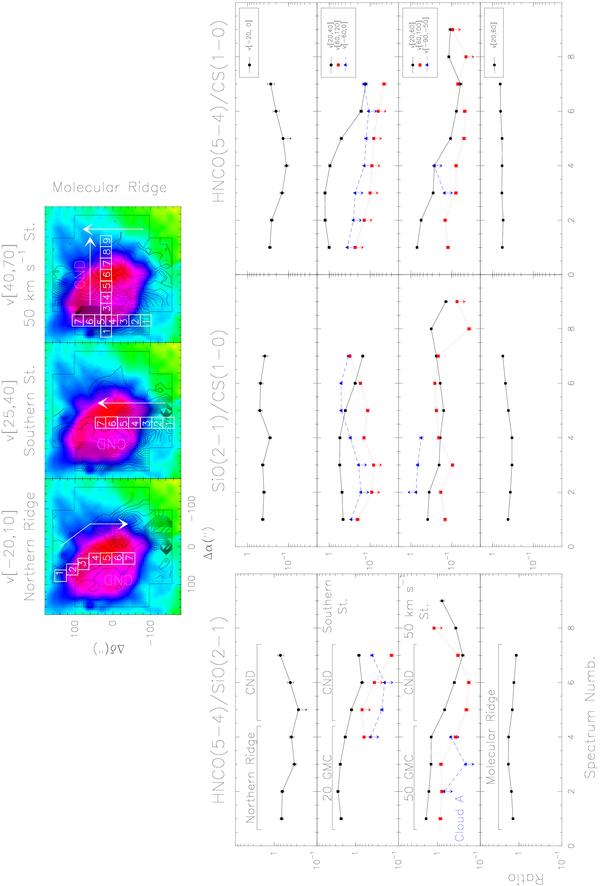
Velocity-integrated HNCO(5–4)/SiO(2–1) (left), SiO(2–1)/CS(1–0) (middle), and HNCO(5–4)/CS(1–0) (right) ratios along four different directions and different velocity intervals. The four different directions are indicated at the top of the left panels, and they are pointed out with white arrows on the three maps located at the top of the figure. These maps show, in contours, the SiO(2–1) emission in three different velocity ranges (indicated at the top of each map), superimposed on the radio continuum image of Yusef-Zadeh & Morris (1987) at 20 cm on a color scale. The different velocity intervals in which we have integrated the molecular emission are indicated at the upper-right corner of the right panels. For example, three velocity-integrated ratios are shown along the Southern Streamer direction. The one corresponding to the velocity interval of this streamer, [20, 40] km s-1, is shown with black circles connected by black lines, whereas those corresponding to lower and higher velocity intervals, [−60, 0] and [60, 120] km s-1, are represented by blue triangles connected by dashed lines and red squares connected by dotted lines, respectively. The x-axis of the ratio plots represents the spectrum number, that increases from northeast to south in case of the Northern Ridge (1st plot beginning from the top), from south to north in the Southern Streamer (2nd), from east to west in the 50 km s-1 Streamer (3rd), and from south to north in the Molecular Ridge (4th), i.e., in the direction of the white arrows. The white open squares, marked with the spectrum numbers, surround the region where the ratios have been derived, whose spectra can be seen in Fig. 11. Uncertainties in the ratio values represented by the errorbars have been calculated propagating the uncertainties in the intensities, which have been derived assuming a conservative 20% calibration error.
Current usage metrics show cumulative count of Article Views (full-text article views including HTML views, PDF and ePub downloads, according to the available data) and Abstracts Views on Vision4Press platform.
Data correspond to usage on the plateform after 2015. The current usage metrics is available 48-96 hours after online publication and is updated daily on week days.
Initial download of the metrics may take a while.