Fig. 4
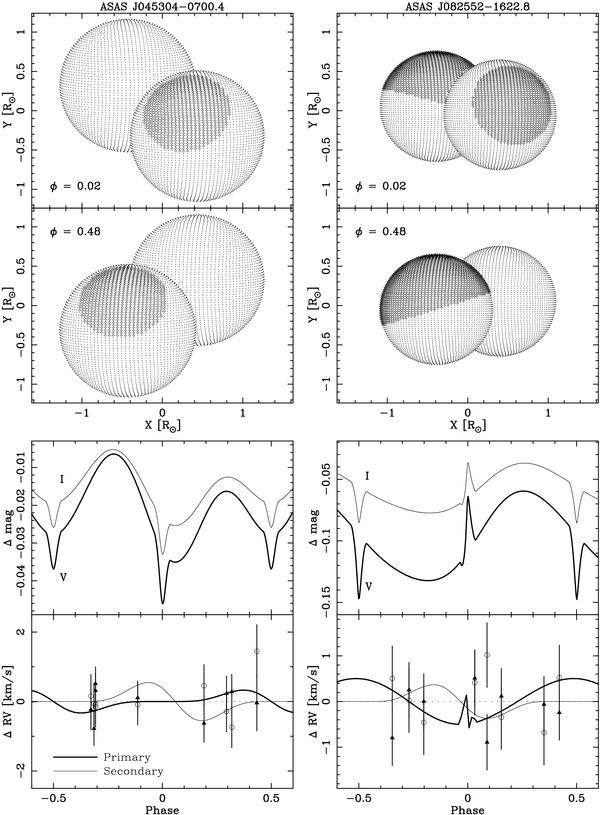
Spots on researched systems. Top: 3D reconstruction of ASAS-04 (left) and ASAS-08 (right) during the primary (φ = 0.02) and secondary eclipse (φ = 0.48). Units are solar radii, scale is the same for both systems; bottom: influence of spots on the ASAS-04 and ASAS-08 light and RV curves. The absolute difference between a spotted and non-spotted case is plotted. Differential RV curves are overplotted on RV residuals, the same as in Fig. 1.
Current usage metrics show cumulative count of Article Views (full-text article views including HTML views, PDF and ePub downloads, according to the available data) and Abstracts Views on Vision4Press platform.
Data correspond to usage on the plateform after 2015. The current usage metrics is available 48-96 hours after online publication and is updated daily on week days.
Initial download of the metrics may take a while.