Fig. 2
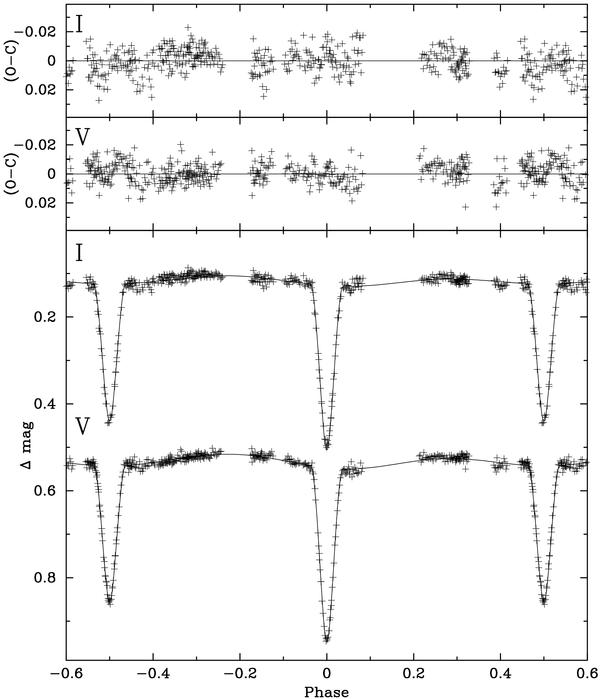
ASAS-04 light curve in V and I band phase-folded with the best-fitting orbital period P = 1.62221933 d. The lower panel shows (artificially shifted) model light curves together with the data points obtained from the 1.0-m Elizabeth telescope. The two upper panels show the residuals from the best fit. An out-of-eclipse variation is clearly visible.
Current usage metrics show cumulative count of Article Views (full-text article views including HTML views, PDF and ePub downloads, according to the available data) and Abstracts Views on Vision4Press platform.
Data correspond to usage on the plateform after 2015. The current usage metrics is available 48-96 hours after online publication and is updated daily on week days.
Initial download of the metrics may take a while.