Fig. 1
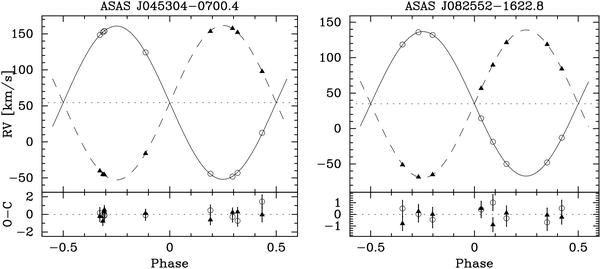
Radial velocities of ASAS-04 (left) and ASAS-08 (right) from our Keck spectra together with the corresponding best-fitting radial velocity (RV) models. The RVs of the primaries are plotted with open circles and those of the secondaries with triangles. The solid line shows the best fit for the primaries and the dashed line that for the secondaries. The dotted line shows the systemic velocity γ.
Current usage metrics show cumulative count of Article Views (full-text article views including HTML views, PDF and ePub downloads, according to the available data) and Abstracts Views on Vision4Press platform.
Data correspond to usage on the plateform after 2015. The current usage metrics is available 48-96 hours after online publication and is updated daily on week days.
Initial download of the metrics may take a while.