Fig. 2
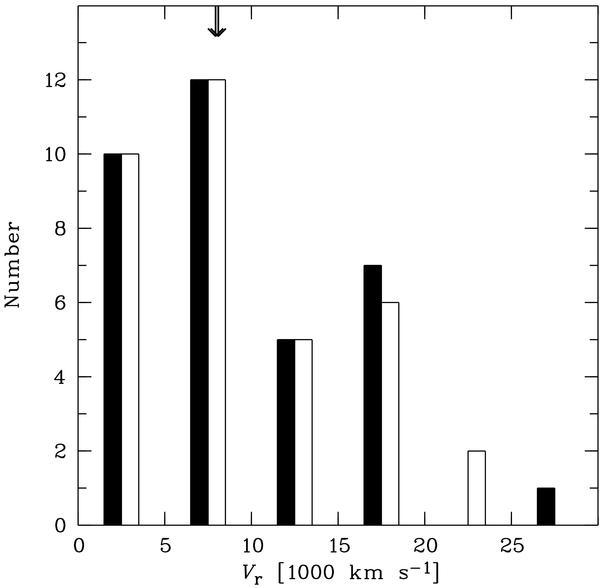
Distribution of Vr for the Sy sample (black columns, taken from NED) and the control one (empty columns, taken from the CfA Survey). The bin size is 5000 km s-1. The difference between the median values of the two samples is ≈150 km s-1, thus, the arrows, designating these values, appear blended.
Current usage metrics show cumulative count of Article Views (full-text article views including HTML views, PDF and ePub downloads, according to the available data) and Abstracts Views on Vision4Press platform.
Data correspond to usage on the plateform after 2015. The current usage metrics is available 48-96 hours after online publication and is updated daily on week days.
Initial download of the metrics may take a while.