Fig. 4
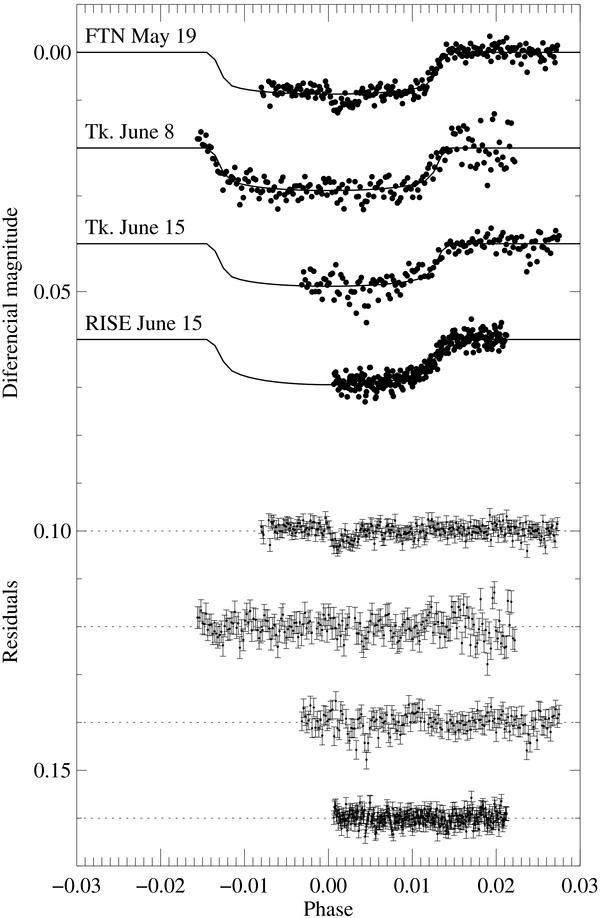
Phase folded light curve for WASP-38. From top to bottom; FTN taken on the 2010 May 19, Takahashi (Tk.) astrograph taken on the 2010 June 8 and 15 and LT/RISE taken on the 2010 June 15. We superimpose the best-fit transit model and also show the residuals for each light curve on the bottom of the figure. The data were binned and displaced vertically for clarity.
Current usage metrics show cumulative count of Article Views (full-text article views including HTML views, PDF and ePub downloads, according to the available data) and Abstracts Views on Vision4Press platform.
Data correspond to usage on the plateform after 2015. The current usage metrics is available 48-96 hours after online publication and is updated daily on week days.
Initial download of the metrics may take a while.