Fig. 1
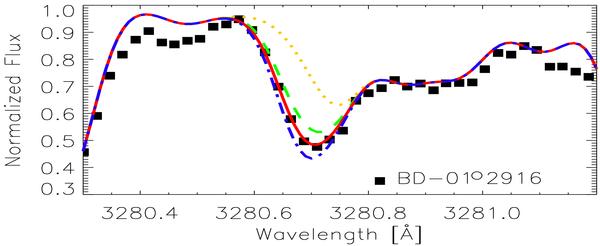
Our best-fit spectrum synthesis of the Ag i 328.0 nm line in the metal-poor giant BD –01° 2916. Symbols and lines are as follows: filled squares – observed spectrum; solid red line – best-fit synthesis computed for [Ag/Fe] = −0.12; dotted yellow line – synthesis computed without silver, dashed green, and dot-dashed blue lines – syntheses computed, respectively, for [Ag/Fe] = −0.3 and + 0.05.
Current usage metrics show cumulative count of Article Views (full-text article views including HTML views, PDF and ePub downloads, according to the available data) and Abstracts Views on Vision4Press platform.
Data correspond to usage on the plateform after 2015. The current usage metrics is available 48-96 hours after online publication and is updated daily on week days.
Initial download of the metrics may take a while.