Fig. 12
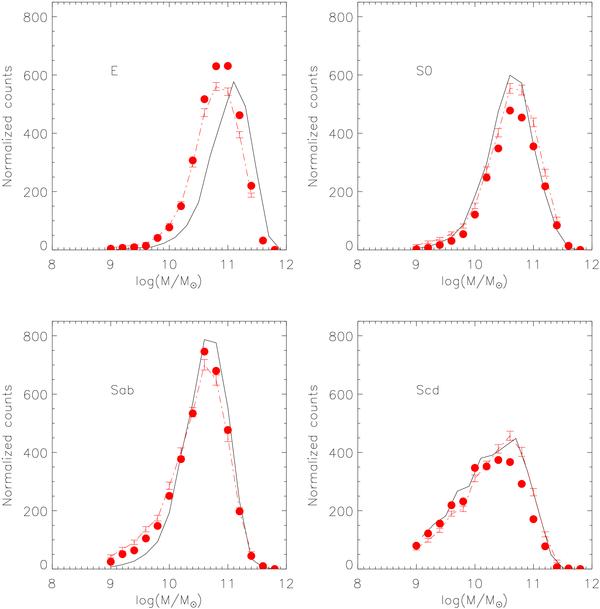
Observed distribution of masses for different morphological types in the Nair & Abraham (2010) sample using different estimators (see tex for details). Black solid lines: visual classification; red filled circles: probability cuts; red dashed line: probability estimates. Each panel shows a visual morphological class from Nair & Abraham (2010), selected as described in the text. For the probability cuts, we use P > 0.45 in this given type.
Current usage metrics show cumulative count of Article Views (full-text article views including HTML views, PDF and ePub downloads, according to the available data) and Abstracts Views on Vision4Press platform.
Data correspond to usage on the plateform after 2015. The current usage metrics is available 48-96 hours after online publication and is updated daily on week days.
Initial download of the metrics may take a while.