Free Access
Fig. 10
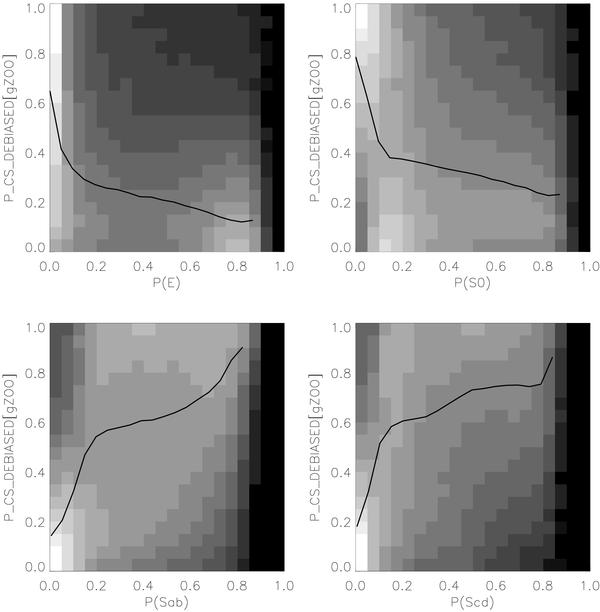
Comparison between the fraction of votes for a galaxy to be spiral like from Galaxy Zoo and the computed probabilities in this work. Gray scales are scaled to the data, i.e. white is maximum and black is minimum. Solid line shows the average relation. The average is computed in 0.05 probability bins.
Current usage metrics show cumulative count of Article Views (full-text article views including HTML views, PDF and ePub downloads, according to the available data) and Abstracts Views on Vision4Press platform.
Data correspond to usage on the plateform after 2015. The current usage metrics is available 48-96 hours after online publication and is updated daily on week days.
Initial download of the metrics may take a while.