Fig. 9
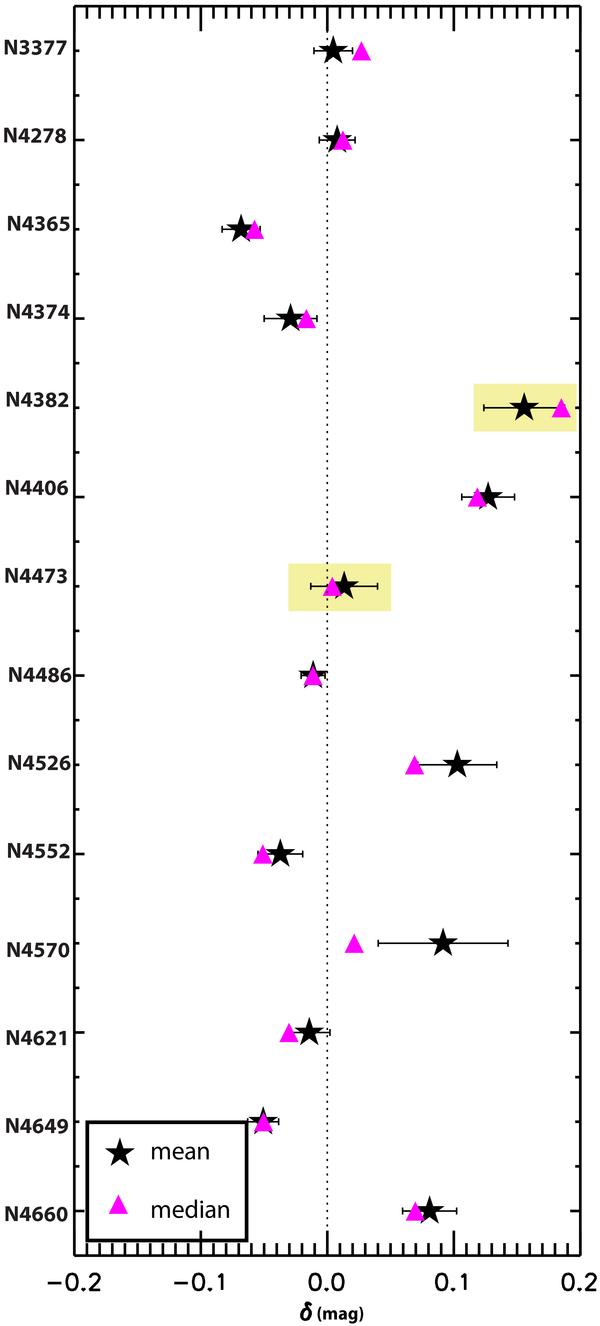
The mean and median of the δ distribution for the GCs of different galaxies, shown in Fig. 8. The error bars centred in the mean indicate the standard error on the mean of the quantity δ. The dotted line stands for δ = 0. NGC 4382 and NGC 4473 are marked with yellow rectangles because their K-band data were obtained in highly extincted conditions.
Current usage metrics show cumulative count of Article Views (full-text article views including HTML views, PDF and ePub downloads, according to the available data) and Abstracts Views on Vision4Press platform.
Data correspond to usage on the plateform after 2015. The current usage metrics is available 48-96 hours after online publication and is updated daily on week days.
Initial download of the metrics may take a while.