Free Access
Fig. 7
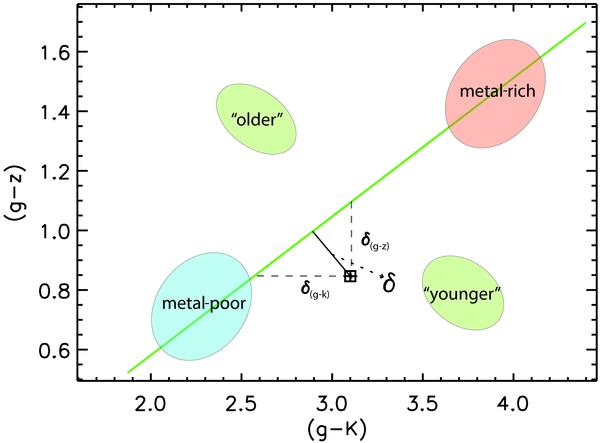
A cartoon illustrating the definition of δ in the (g − K) vs. (g − z) diagram for one cluster (see text for details) and the location of the “younger” and “older” objects relative to the green line. The location of metal-poor and metal-rich objects is also shown.
Current usage metrics show cumulative count of Article Views (full-text article views including HTML views, PDF and ePub downloads, according to the available data) and Abstracts Views on Vision4Press platform.
Data correspond to usage on the plateform after 2015. The current usage metrics is available 48-96 hours after online publication and is updated daily on week days.
Initial download of the metrics may take a while.