Free Access
Fig. 3
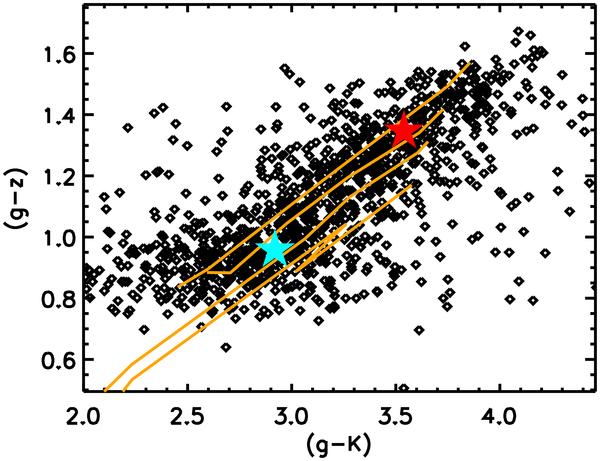
The (g − K) vs. (g − z) 2-colour diagram for the GCs of 12 galaxies combined, excluding NGC 4382 and NGC 4473. The blue and red large symbols correspond to the median colour of the blue and red clusters respectively. The orange lines represent Padova08 SSPs of 2, 3, 6 and 14 Gyr, like in Fig. 1.
Current usage metrics show cumulative count of Article Views (full-text article views including HTML views, PDF and ePub downloads, according to the available data) and Abstracts Views on Vision4Press platform.
Data correspond to usage on the plateform after 2015. The current usage metrics is available 48-96 hours after online publication and is updated daily on week days.
Initial download of the metrics may take a while.