Free Access
Fig. 2
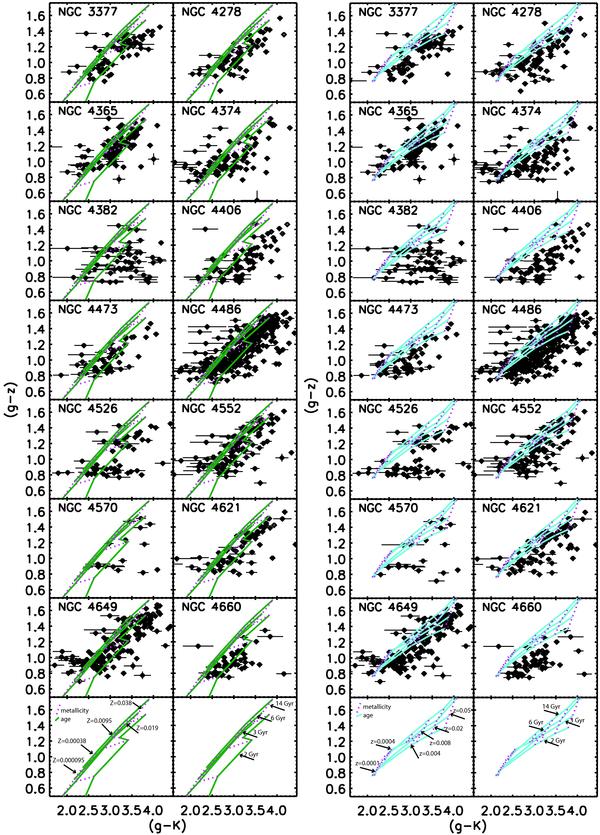
2-colour diagrams for the GC systems of the 14 galaxies. (g − K) vs. (g − z), as in Fig. 1: Maraston (2005) with red horizontal branch at the two lowest metallicities (left panel) and Charlot & Bruzual (in prep.) (right panel).
Current usage metrics show cumulative count of Article Views (full-text article views including HTML views, PDF and ePub downloads, according to the available data) and Abstracts Views on Vision4Press platform.
Data correspond to usage on the plateform after 2015. The current usage metrics is available 48-96 hours after online publication and is updated daily on week days.
Initial download of the metrics may take a while.