Fig. 16
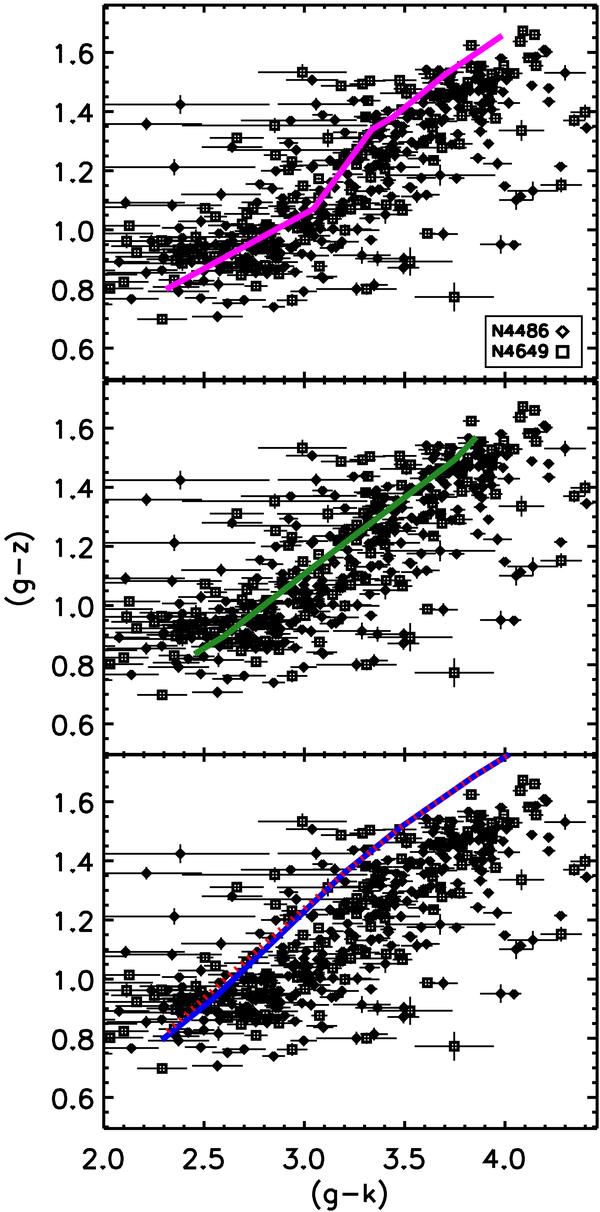
(g − K) vs. (g − z) for GCs of NGC 4486 and NGC 4649, indicated by different symbols. Note the wavy feature the data presents around (g − K) ~ 3.2 and (g − z) ~ 1.2. The different panels have different SSP model over plotted: upper panel: SpOT-Teramo 14 Gyr SSP with a realistic treatment of horizontal branch morphology (Raimondo et al. 2005), middle panel: Padova08 and bottom panel: Maraston (2005).
Current usage metrics show cumulative count of Article Views (full-text article views including HTML views, PDF and ePub downloads, according to the available data) and Abstracts Views on Vision4Press platform.
Data correspond to usage on the plateform after 2015. The current usage metrics is available 48-96 hours after online publication and is updated daily on week days.
Initial download of the metrics may take a while.