Free Access
Fig. 12
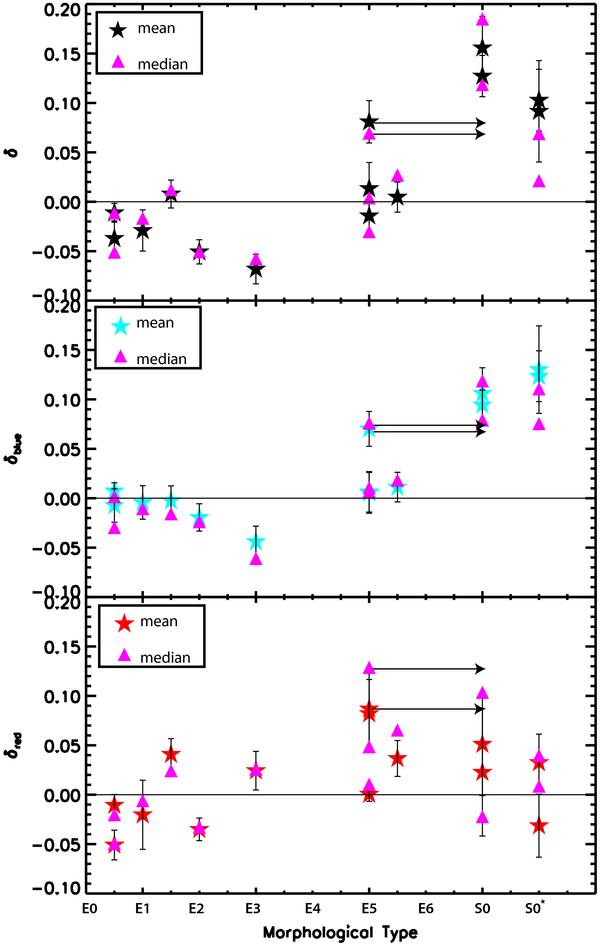
The mean and median of δ, δblue and δred as a function of morphological type in the different panels. The solid line indicates the value where the mean of the GCs would not differ from the relations (1)−(3). The arrows indicate the location of the values for NGC 4660 when classified as S0 instead of E5.
Current usage metrics show cumulative count of Article Views (full-text article views including HTML views, PDF and ePub downloads, according to the available data) and Abstracts Views on Vision4Press platform.
Data correspond to usage on the plateform after 2015. The current usage metrics is available 48-96 hours after online publication and is updated daily on week days.
Initial download of the metrics may take a while.