Fig. 1
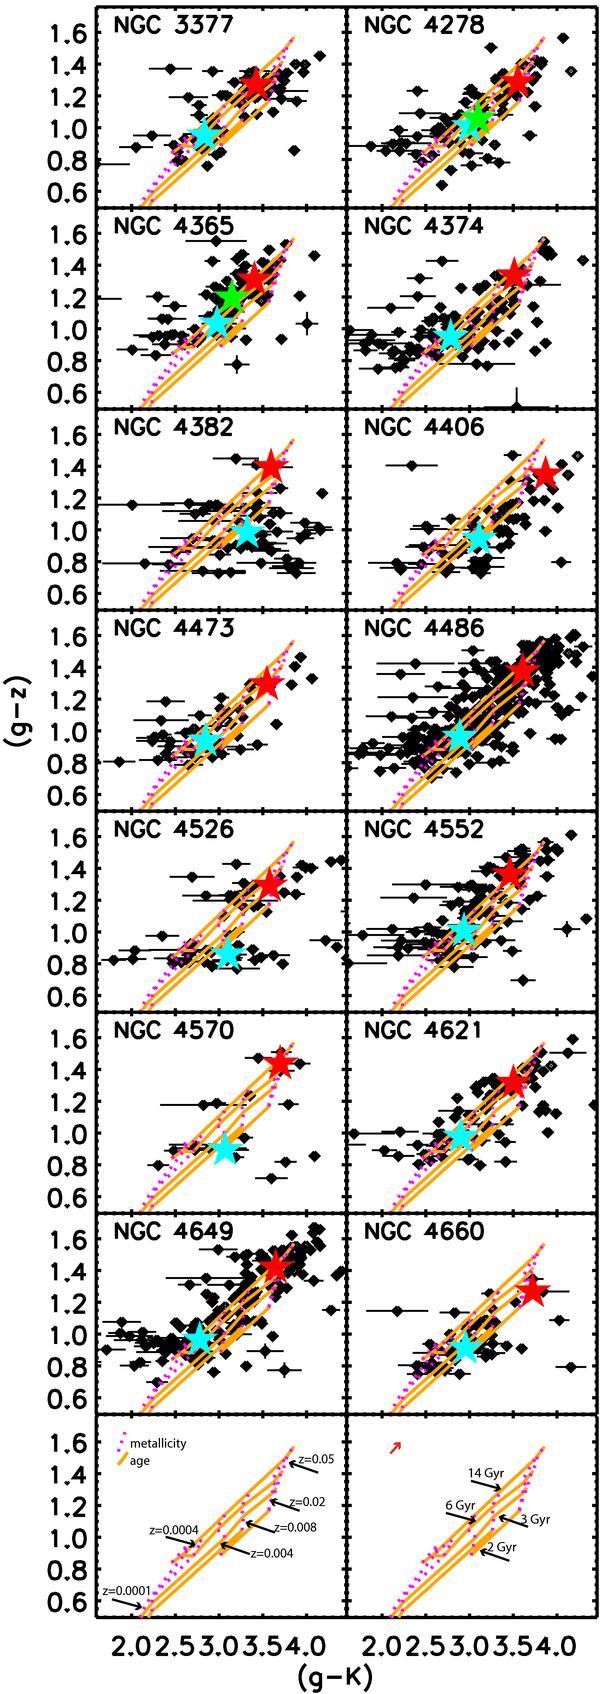
2-colour diagrams for the GC systems of the 14 galaxies. (g − z) vs. (g − K). Padova08 SSP models are overplotted with model sequences of constant age and metallicity according to the legend in the bottom panels. The ages increase from the lower right to the upper left. The metallicity tracks increase from the lower left to the upper right. The large blue and red star symbols indicate the medians of the blue and red sub-populations, respectively. They are divided assuming a common division value of (g − z) = 1.187. The green symbol in the panels corresponding to NGC 4365 and NGC 4278 indicates the median of the single populations as the (g − z) distribution of these galaxies was considered to be more likely unimodal. The red arrow on the bottom most right panel indicates a typical reddening vector.
Current usage metrics show cumulative count of Article Views (full-text article views including HTML views, PDF and ePub downloads, according to the available data) and Abstracts Views on Vision4Press platform.
Data correspond to usage on the plateform after 2015. The current usage metrics is available 48-96 hours after online publication and is updated daily on week days.
Initial download of the metrics may take a while.