Fig. 9
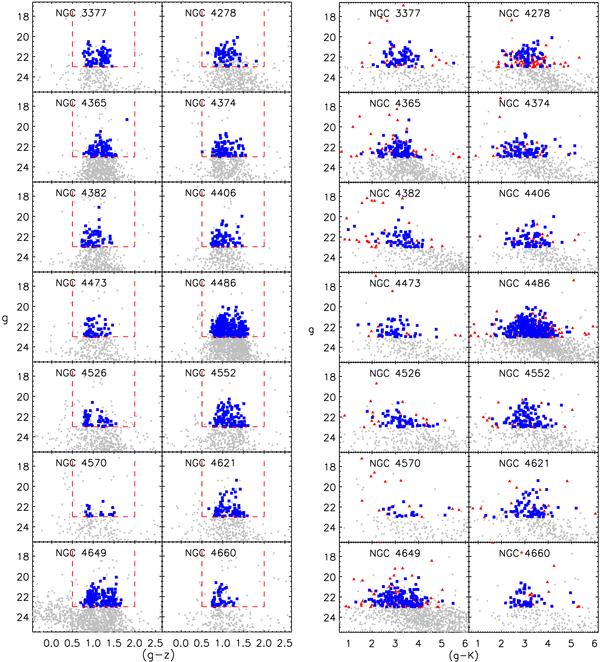
Left panel: optical ((g − z) vs. g) colour magnitude diagrams for globular cluster candidates detected in g, z and K that had a size assigned to by ISHAPE in grey. The box with dashed red lines defines the colour and magnitude cuts. Only objects brighter than g = 23 and with optical colours in the range 0.5 < (g − z) < 2 were maintained in the sample. The final sample of GCs after visual inspection and size cut (see text for details) are indicated as blue squares. Right panel: optical/NIR ((g − k) vs. g) colour magnitude diagrams for the same objects as in the left panel. Objects inside the box with dashed lines that are grey dots in the left panel are shown as red triangles in the right panel. Blue squares are as in the left panel.
Current usage metrics show cumulative count of Article Views (full-text article views including HTML views, PDF and ePub downloads, according to the available data) and Abstracts Views on Vision4Press platform.
Data correspond to usage on the plateform after 2015. The current usage metrics is available 48-96 hours after online publication and is updated daily on week days.
Initial download of the metrics may take a while.