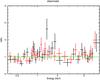
Fig. 1
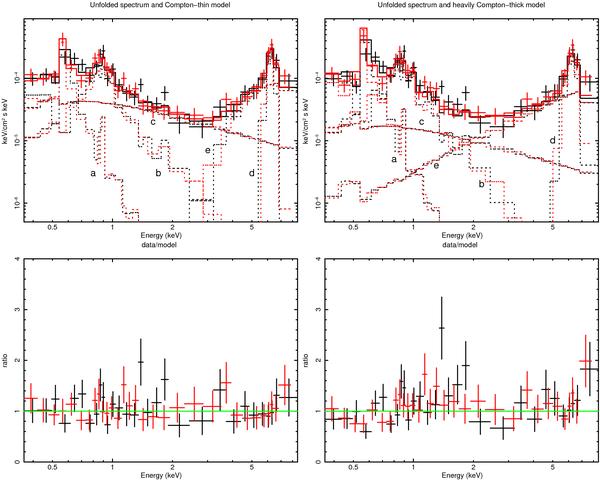
XMM-Newton (MOS1 – black data points in the electronic version and MOS2 – red data points in the electronic version) unfolded spectrum of IRAS 04507+0358 fitted with a Compton-thin (left panel) and a Compton-thick model (right panel). In the lower panels the ratio between data and best-fit models are shown. In the Compton-thin hypothesis, the data are best reproduced by two thermal emission components (a), b)) plus a power-law absorbed only by the Galactic column density (scattering component, c)) and a power-law absorbed by a high column density (NH = (4 ± 2) × 1023 cm-2) absorber e). The two power-laws have the same Γ fixed to 1.9. A prominent iron line is also present d). A similarly good fit could be obtained by using a cold reflection component instead of the absorbed power-law (component e) in the right panel).
Current usage metrics show cumulative count of Article Views (full-text article views including HTML views, PDF and ePub downloads, according to the available data) and Abstracts Views on Vision4Press platform.
Data correspond to usage on the plateform after 2015. The current usage metrics is available 48-96 hours after online publication and is updated daily on week days.
Initial download of the metrics may take a while.