Fig. 8
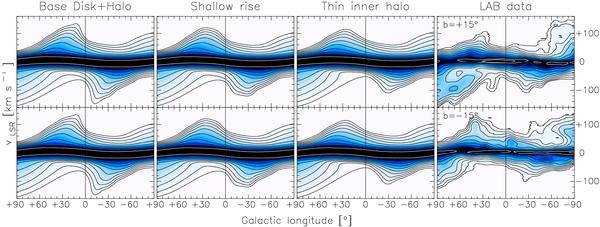
l − v slices at b = +15° (top) and b = −15° (bottom) at longitudes −90° < l < 90°. First column: the best model shown in Fig. 6; second column: the model refined including a radial dependence of dvφ/d |z| for R < 4.5 kpc; third column: the model refined including a linear decrease of the halo thickness for R < R⊙; fourth column: the LAB data. Each datacube is smoothed to 8° resolution. Contour levels in brightness temperature from 0.04 K to 81.92 K scaling by a factor 2.
Current usage metrics show cumulative count of Article Views (full-text article views including HTML views, PDF and ePub downloads, according to the available data) and Abstracts Views on Vision4Press platform.
Data correspond to usage on the plateform after 2015. The current usage metrics is available 48-96 hours after online publication and is updated daily on week days.
Initial download of the metrics may take a while.