Fig. 6
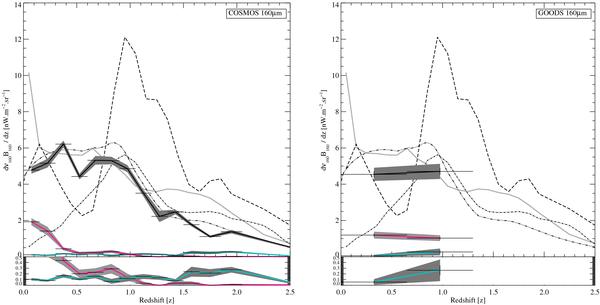
Differential 160 μm background brightness dν160B160 / dz as a function of redshift, in units of nW m-2 sr-1, in the COSMOS field (left) and GOODS field (right). The lower part of the plot shows a linear zoom between 0 and 0.5 nW m-2 sr-1 to show more clearly the trend of cleaned sources and AGNs. Black solid lines: total contribution of infrared galaxies. Solid red lines: contribution from resolved sources only. Solid blue line: contribution from AGN only. Dashed line: Lagache et al. (2004) model, with S24 > 80 μ Jy cut. Dotted line: Le Borgne et al. (2009) model, with S24 > 80 μ Jy cut. Dot-dash line: Valiante et al. (2009). Dot-dot-dot-dash line: Bethermin et al. (2010c) model, with S24 > 80 μ Jy cut. Models are presented and discussed in Sect. 4.5 and Fig. 10.
Current usage metrics show cumulative count of Article Views (full-text article views including HTML views, PDF and ePub downloads, according to the available data) and Abstracts Views on Vision4Press platform.
Data correspond to usage on the plateform after 2015. The current usage metrics is available 48-96 hours after online publication and is updated daily on week days.
Initial download of the metrics may take a while.