Fig. 3
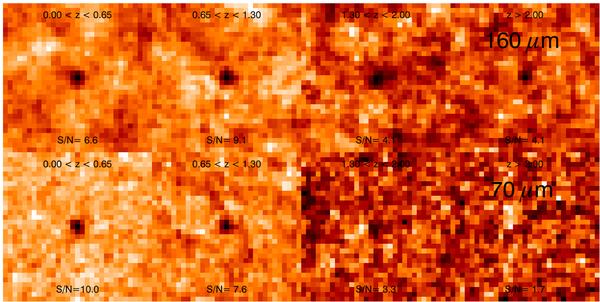
Images of all the stacked galaxies in the 160 μm (top) and 70 μm (bottom) GOODS CLEANed maps by redshift bin (right to left): 0 < z < 0.65, 0.65 < z < 1.3, 1.3 < z < 2, and z > 2. The signal-to-noise ratio (S/N) is indicated in each image. Note the detection in the two first redshift bins at both wavelengths. Images are 305 × 305 sq. arcsec. wide at 70 μm (with 9.85 arcsec pixel plate), and 496 × 496 sq. arcsec. at 160 μm (with 16 arcsec pixel plate). The PSF FWHM being 18 arcsec and 40 arcsec at 70 μm and 160 μm respectivly, the PSF shown on these figures has about the same extent of 1.8 to 2.5 pixels at both wavelengths.
Current usage metrics show cumulative count of Article Views (full-text article views including HTML views, PDF and ePub downloads, according to the available data) and Abstracts Views on Vision4Press platform.
Data correspond to usage on the plateform after 2015. The current usage metrics is available 48-96 hours after online publication and is updated daily on week days.
Initial download of the metrics may take a while.