Fig. 9
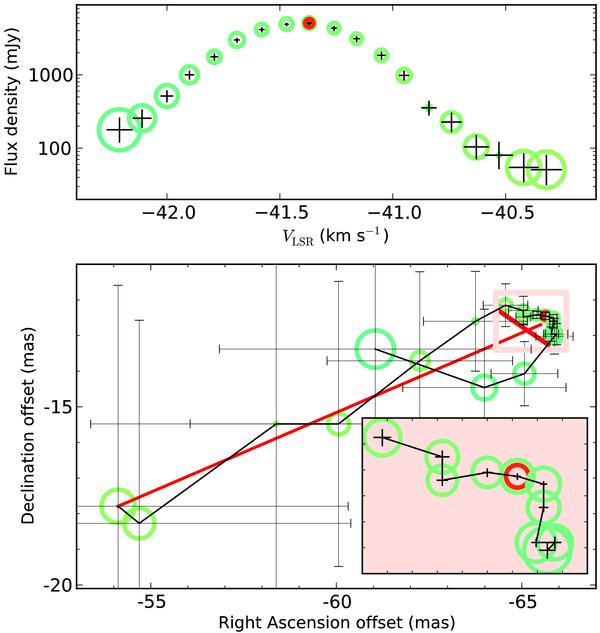
Properties of the maser feature E in Fig. 8, with the same coloring scheme. Top: feature line profile. The symbol diameters are proportional to sυ (two are very small); the error bars show the size uncertainty σs. Bottom: detailed map of the components comprising the feature. The diameter of each symbol is 10% of sυ and the error bars represent the position offset uncertainties. The thin black line joins the components in velocity order. The long thin red line denotes the largest angular size l of the feature. The short fat red line shows the separation of the components with flux densities closest to the half-maximum of the feature, d. The expanded-scale inset (total size 1.7 × 1.2 mas, ticks at 0.2 mas intervals) shows the area in the pink box, which contains the components brighter than half maximum, with component size error bars. The brightest component is outlined in red, also marked on the top plot.
Current usage metrics show cumulative count of Article Views (full-text article views including HTML views, PDF and ePub downloads, according to the available data) and Abstracts Views on Vision4Press platform.
Data correspond to usage on the plateform after 2015. The current usage metrics is available 48-96 hours after online publication and is updated daily on week days.
Initial download of the metrics may take a while.