Fig. 19
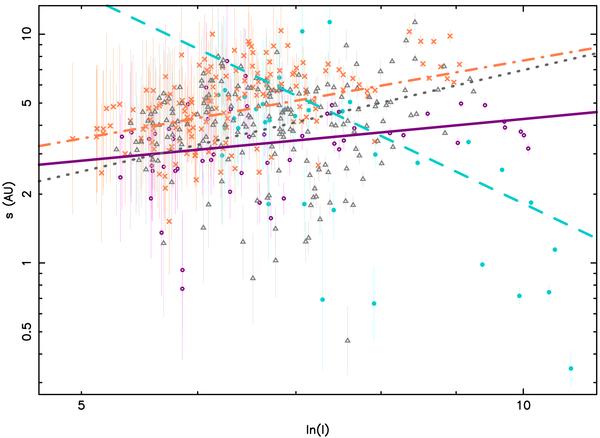
U Ori maser component FWHM sυ as a function of the natural logarithm of the intensity I, for components where sυ > 3σs. The magenta (hollow), cyan (solid), orange (cross) and grey (triangle) symbols represent 1994, 1999, 2000 and 2001 results, respectively. The corresponding error-weighted least-squares fits (to all data) are shown as solid, dashed, dot-dashed and dotted lines.
Current usage metrics show cumulative count of Article Views (full-text article views including HTML views, PDF and ePub downloads, according to the available data) and Abstracts Views on Vision4Press platform.
Data correspond to usage on the plateform after 2015. The current usage metrics is available 48-96 hours after online publication and is updated daily on week days.
Initial download of the metrics may take a while.