Fig. 13
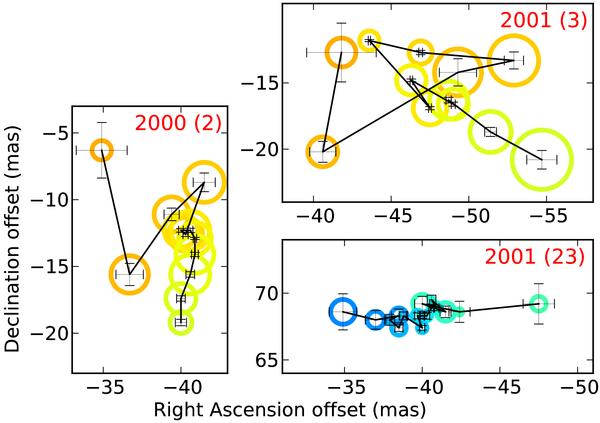
The angular size and distribution of the maser components in the U Ori features marked in Fig. 12, with the same colouring scheme. Each panel shows a single feature. The diameter of each symbol is 10% of sυ and the error bars represent the position offset uncertainties. The line joining the components shows the velocity order.
Current usage metrics show cumulative count of Article Views (full-text article views including HTML views, PDF and ePub downloads, according to the available data) and Abstracts Views on Vision4Press platform.
Data correspond to usage on the plateform after 2015. The current usage metrics is available 48-96 hours after online publication and is updated daily on week days.
Initial download of the metrics may take a while.