Fig. 11
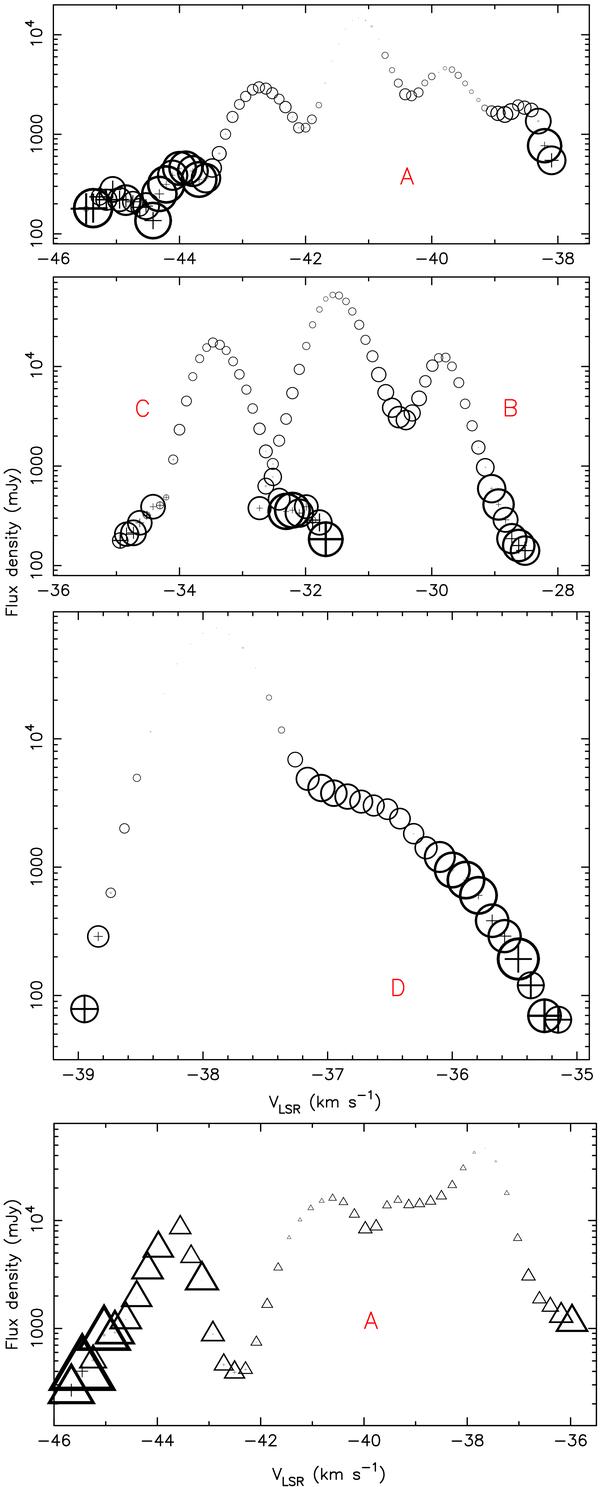
Top to bottom: the line profiles of features seen around S Per in 1994 (circles) in the regions labelled A, B, C and D in Fig. 8, and in 1999 (triangles) in the region labelled A in Fig. 8. The diameters of the circles/triangles and of the crosses are proportional to the observed angular FWHM sυ of the maser components and to σs, respectively.
Current usage metrics show cumulative count of Article Views (full-text article views including HTML views, PDF and ePub downloads, according to the available data) and Abstracts Views on Vision4Press platform.
Data correspond to usage on the plateform after 2015. The current usage metrics is available 48-96 hours after online publication and is updated daily on week days.
Initial download of the metrics may take a while.