Fig. 10
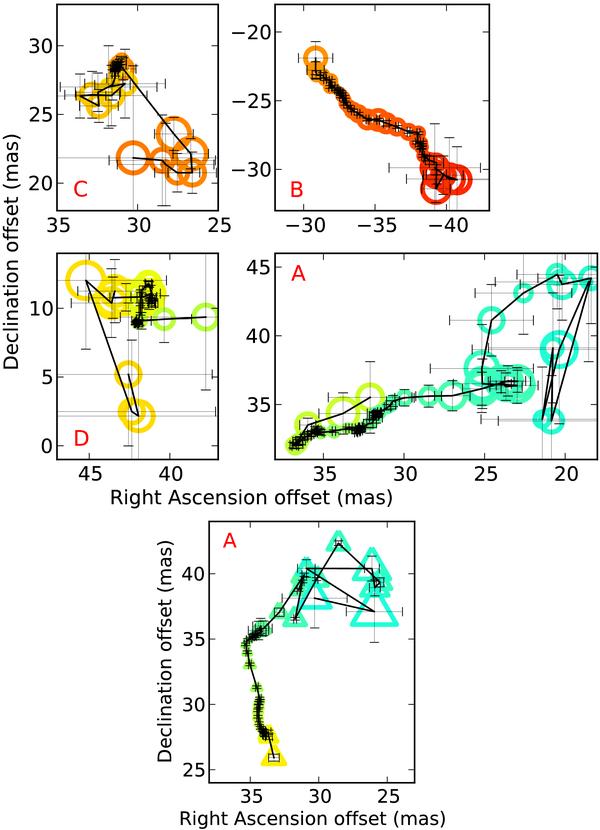
The angular size, distribution and position uncertainties of the maser components making up the boxed features A–D around S Per in Fig. 8, as measured in 1994 (upper and middle plots, circles) and the features in A as measured in 1999 (lower plot, triangles). The same velocity colour scheme is used. Region A contains 6 features in 1994 and 5 in 1999; the other regions contain 2 features, as can be seen from the spectral peaks in Fig. 11. The diameter of each symbol is 10% of sυ. The black lines join the components in velocity order. The position uncertainties are shown.
Current usage metrics show cumulative count of Article Views (full-text article views including HTML views, PDF and ePub downloads, according to the available data) and Abstracts Views on Vision4Press platform.
Data correspond to usage on the plateform after 2015. The current usage metrics is available 48-96 hours after online publication and is updated daily on week days.
Initial download of the metrics may take a while.