Fig. 9
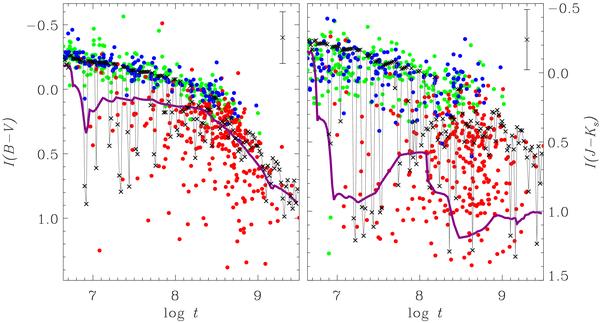
Integrated colours of open clusters vs. cluster age. The left panel shows data for (B − V), the right one for (J − Ks). The observations of the Galactic open clusters are indicated by dots, blue for MS-clusters, green for post-MS clusters, and red for RG-clusters (see Sect. 2 for explanation). Bars in the upper-right corner of each panel mark typical errors of the integrated colours. The solid curves are evolutionary tracks of a SSP model with a continuous IMF for a cluster with Mc = 103 m⊙ and ml = 0.1 m⊙. The connected symbols (crosses) show the discrete-IMF option of this model.
Current usage metrics show cumulative count of Article Views (full-text article views including HTML views, PDF and ePub downloads, according to the available data) and Abstracts Views on Vision4Press platform.
Data correspond to usage on the plateform after 2015. The current usage metrics is available 48-96 hours after online publication and is updated daily on week days.
Initial download of the metrics may take a while.