Fig. 7
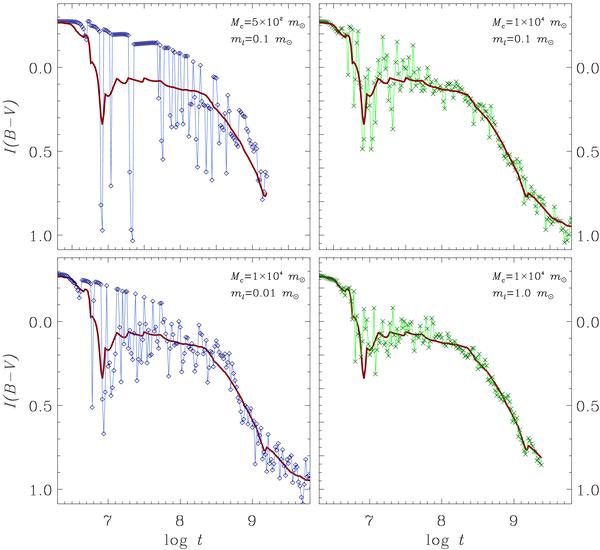
Evolution of cluster colour in the optical regime and the effects of Mc (upper row) and ml (bottom row). The curve in all panels shows the continuous-IMF model, the connected symbols show the discrete-IMF case. In the upper row we compare Mc = 5 × 10² m⊙ (left) and 104 m⊙ (right) cases for ml = 0.1 m⊙. The lower row is constructed for Mc = 104 m⊙ and ml = 0.01 m⊙ (left) and 1 m⊙ (right).
Current usage metrics show cumulative count of Article Views (full-text article views including HTML views, PDF and ePub downloads, according to the available data) and Abstracts Views on Vision4Press platform.
Data correspond to usage on the plateform after 2015. The current usage metrics is available 48-96 hours after online publication and is updated daily on week days.
Initial download of the metrics may take a while.