Fig. 5
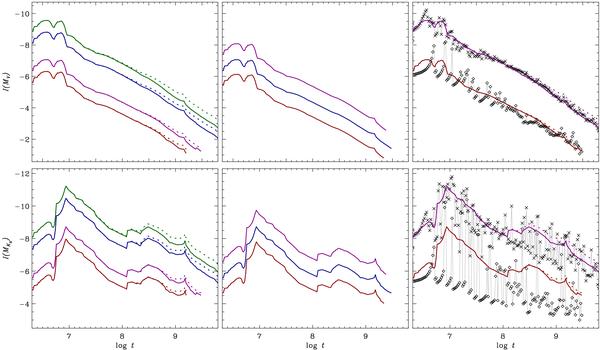
Evolution of cluster luminosity in the optical (upper row) and NIR (lower row). The curves in the left and middle panels present SSP models with continuous IMF, whereas in the right panel we compare continuous and discrete options. Left panels: impact of dynamical mass loss on integrated luminosity of clusters of different masses and stellar low-mass limit ml = 0.1 m⊙. The four curves from top to bottom are models for clusters with masses Mc = 104 m⊙, Mc = 5 × 10³ m⊙, Mc = 103 m⊙, and Mc = 5 × 10² m⊙, respectively. The dotted curves indicate models without mass loss. Middle panels: influence of different lower mass limits ml of cluster stars on integrated luminosity of clusters with mass Mc = 103 m⊙. The upper, middle, and bottom curves correspond to ml = 1, 0.1, 0.01 m⊙, respectively. Right panels: integrated magnitudes of clusters modelled with continuous (curves) and discrete (connected symbols) IMFs for stellar low-mass limit ml = 0.1 m⊙. The upper curve and crosses are for cluster mass Mc = 104 m⊙, and the bottom curve and diamonds are for Mc = 103 m⊙. The mass loss owing to dynamical evolution is incorporated in both models. For comparison, the continuous model without mass loss is shown by the dotted curves.
Current usage metrics show cumulative count of Article Views (full-text article views including HTML views, PDF and ePub downloads, according to the available data) and Abstracts Views on Vision4Press platform.
Data correspond to usage on the plateform after 2015. The current usage metrics is available 48-96 hours after online publication and is updated daily on week days.
Initial download of the metrics may take a while.