Fig. 4
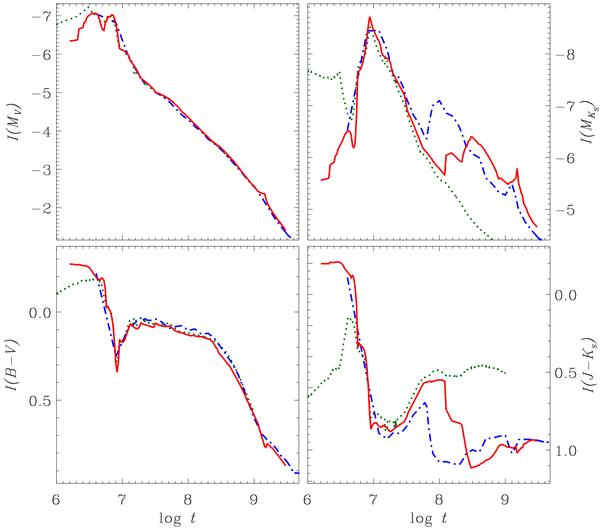
Evolutionary tracks developed in this paper (solid red curves) and models computed with the help of the online SSP-servers SB99 (dotted green curve) and GALEV (dash-dotted blue curve). The left panels show optical magnitudes and colours, the right panels are for NIR passbands. The adopted model parameters are given in the text.
Current usage metrics show cumulative count of Article Views (full-text article views including HTML views, PDF and ePub downloads, according to the available data) and Abstracts Views on Vision4Press platform.
Data correspond to usage on the plateform after 2015. The current usage metrics is available 48-96 hours after online publication and is updated daily on week days.
Initial download of the metrics may take a while.