Fig. 3
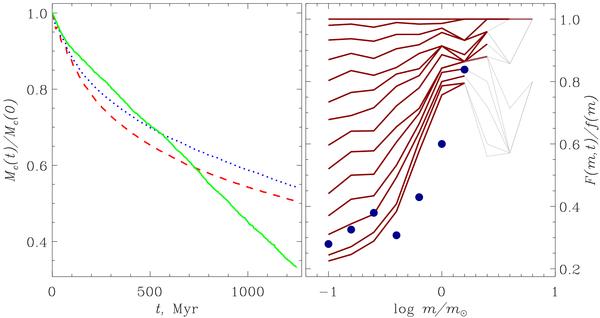
Mass loss from star clusters according to high-resolution N-body models by Berczik & Petrov (2008). The left panel shows the relative loss of the total mass of clusters orbiting at the solar galactocentric distance (RG = 8.5 kpc). The solid (green), dotted (blue), and dashed (red) curves are for clusters of the initial masses Mc = 103, 5 × 10³, 104 m⊙, respectively. The right panel demonstrates selective mass loss occurring among stars of different masses m/m⊙ in a cluster with Mc = 103 m⊙. The curves show the evolution of the MF-to-IMF ratio F(m,t)/f(m) with time, starting from t = 0 Myr, with a step of 100 Myr and last point t = 1249 Myr. The dots show the data of Anders et al. (2009) scaled to a cluster with mass Mc = 103 m⊙ and the age of 1249 Myr. The red portions of the curves correspond to stars alive and grey ones to stellar remnants.
Current usage metrics show cumulative count of Article Views (full-text article views including HTML views, PDF and ePub downloads, according to the available data) and Abstracts Views on Vision4Press platform.
Data correspond to usage on the plateform after 2015. The current usage metrics is available 48-96 hours after online publication and is updated daily on week days.
Initial download of the metrics may take a while.