Fig. 2
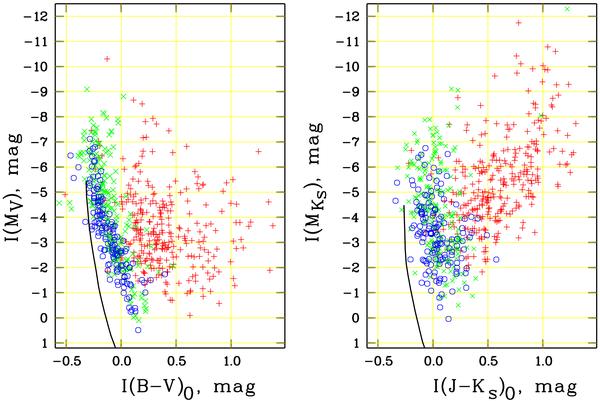
Empirical colour–magnitude diagrams of 650 open clusters identified in the ASCC-2.5 in the optical (left panel) and the NIR (right panel) photometric passbands. The symbols follow the classification scheme shown in Fig. 1. The blue circles mark the clusters with main sequence stars only, the green crosses are clusters where post-MS stars are found as well, and the red pluses indicate clusters that contain at least one red [super]giant. For comparison, the solid black curve shows the empirical ZAMS of Schmidt-Kaler for stars.
Current usage metrics show cumulative count of Article Views (full-text article views including HTML views, PDF and ePub downloads, according to the available data) and Abstracts Views on Vision4Press platform.
Data correspond to usage on the plateform after 2015. The current usage metrics is available 48-96 hours after online publication and is updated daily on week days.
Initial download of the metrics may take a while.