Fig. 13
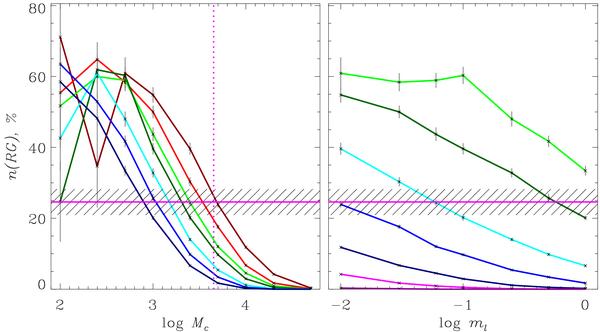
The dependence of frequency n(RG) of red flashes on cluster parameters as derived from Monte-Carlo experiments. The left panel shows a dependence on Mc with ml = 0.01, 0.03, 0.06, 0.1, 0.25, 0.5, 1 m⊙ (from top to bottom along the dotted line). The right panel shows a dependence of n(RG) on ml with Mc = 5 × 10², 103, 2.5 × 10³, 5 × 10³, 104, 2 × 10⁴, 5 × 10⁴ m⊙ (from top to bottom). The bars indicate statistical uncertainties derived in the experiments. The horizontal solid line marks the observed frequency of local RG-clusters within the completeness area of the cluster sample of 850 pc. The hatched area corresponds to the Poisson error of this estimate. The vertical dashed line in the left panel shows the estimated value of the average mass of formed clusters from Piskunov et al. (2008a).
Current usage metrics show cumulative count of Article Views (full-text article views including HTML views, PDF and ePub downloads, according to the available data) and Abstracts Views on Vision4Press platform.
Data correspond to usage on the plateform after 2015. The current usage metrics is available 48-96 hours after online publication and is updated daily on week days.
Initial download of the metrics may take a while.